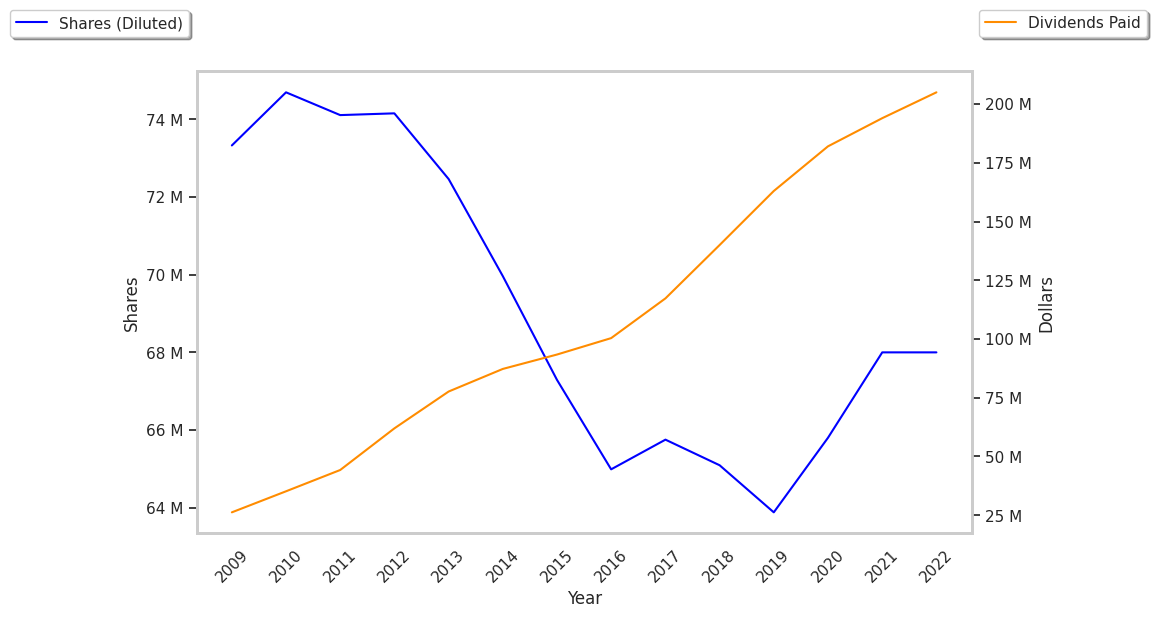
It's been a great morning session for Reinsurance investors, who saw their shares rise 1.6% to a price of $234.75 per share. At these higher prices, is the company still fairly valued? If you are thinking about investing, make sure to check the company's fundamentals before making a decision.
Reinsurance Has Attractive Multiples and Trades Below Its Graham Number:
Reinsurance Group of America, Incorporated provides life and health, and asset-intensive reinsurance in the United States, Latin America, Canada, Europe, the Middle East, Africa, Asia, and Australia. The company belongs to the Finance sector, which has an average price to earnings (P/E) ratio of 15.92 and an average price to book (P/B) ratio of 1.78. In contrast, Reinsurance has a trailing 12 month P/E ratio of 12.8 and a P/B ratio of 1.16.
P/E rations can be placed into context by dividing them by the firm's expected 5-year EPS growth rate, which gives us its Price to Earnings Growth (PEG) ratio. Reinsurance's PEG ratio is 1.14, which tells us the company is fairly valued in terms of growth. PEG ratios under 1 are considered an indicator of undervalued growth, but we need to keep in mind that many successful companies with excellent share performance have maintained much higher PEG ratios.
As always, a quantitative approach to a stock should be supplemented with a look at qualitative factors, such as the competence of its management team, quality of its corporate culture, and the wide variety of social and economic factors that can impact the success of its product.
Growing Revenues and Generally Positive Cash Flows:
| 2020 | 2021 | 2022 | 2023 | 2024 | 2025 | |
|---|---|---|---|---|---|---|
| Revenue (M) | $14,596 | $16,667 | $16,227 | $18,567 | $22,107 | $23,698 |
| Interest Income (M) | $170 | $139 | $191 | $257 | $304 | $366 |
| Operating Margins | 4% | 8% | 4% | 6% | 4% | 6% |
| Net Margins | 3% | 7% | 3% | 5% | 3% | 5% |
| Net Income (M) | $415 | $1,170 | $517 | $902 | $717 | $1,182 |
| Depreciation & Amort. (M) | $17 | $16 | $15 | $387 | $46 | $43 |
| Diluted Shares (M) | 66 | 68 | 68 | 67 | 67 | 67 |
| Earnings Per Share | $6.31 | $17.13 | $7.64 | $13.44 | $10.73 | $17.69 |
| EPS Growth | n/a | 171.47% | -55.4% | 75.92% | -20.16% | 64.86% |
| Avg. Price | $98.49 | $111.94 | $110.27 | $161.78 | $213.77 | $231.16 |
| P/E Ratio | 15.51 | 6.49 | 14.27 | 11.9 | 19.61 | 12.89 |
| Free Cash Flow (M) | $3,294 | $4,163 | $1,318 | $3,942 | $9,342 | $3,815 |
| CAPEX (M) | $28 | $19 | $25 | $102 | $28 | $276 |
| EV / EBITDA | 11.91 | 5.96 | 11.52 | 7.93 | 15.37 | 10.62 |
| Total Debt (M) | $3,573 | $3,667 | $3,961 | $4,427 | $5,042 | $5,710 |
| Net Debt / EBITDA | 1.1 | 0.53 | 1.41 | 0.94 | 1.67 | 0.97 |
Reinsurance has growing revenues and increasing reinvestment in the business and low leverage levels. Additionally, the company's financial statements display a strong EPS growth trend and generally positive cash flows. However, the firm has weak operating margins with a stable trend.