Cadence Design Systems logged a -10.7% change during today's morning session, and is now trading at a price of $325.52 per share.
Cadence Design Systems returned gains of 15.6% last year, with its stock price reaching a high of $416.69 and a low of $262.75. Over the same period, the stock underperformed the S&P 500 index by -4.1%. The company's 50-day average price was $375.36. Cadence Design Systems, Inc. develops computational, AI-driven software, hardware, and silicon intellectual property products and solutions. Based in San Jose, CA, the Large-Cap Technology company has 15,110 full time employees. Cadence Design Systems has not offered a dividend during the last year.
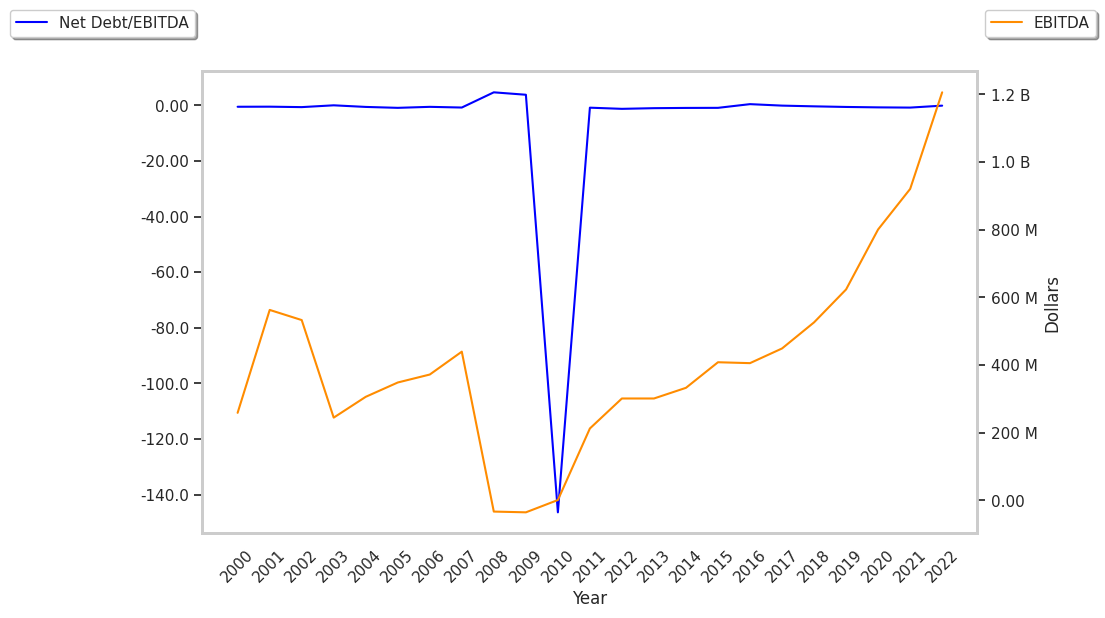
Strong Revenue Growth and Healthy Leverage Levels:
| 2019 | 2021 | 2022 | 2023 | 2024 | 2025 | |
|---|---|---|---|---|---|---|
| Revenue (M) | $2,336 | $2,683 | $2,988 | $4,090 | $4,641 | $5,297 |
| Operating Margins | 21% | 24% | 26% | 31% | 29% | 28% |
| Net Margins | 42% | 22% | 23% | 25% | 23% | 21% |
| Net Income (M) | $989 | $591 | $696 | $1,041 | $1,055 | $1,109 |
| Net Interest Expense (M) | $19 | $21 | $17 | $36 | $76 | $117 |
| Depreciation & Amort. (M) | $63 | $68 | $71 | $78 | $97 | $111 |
| Diluted Shares (M) | 281 | 278 | 275 | 273 | 274 | 273 |
| Earnings Per Share | $3.53 | $2.11 | $2.5 | $3.82 | $3.85 | $4.06 |
| EPS Growth | n/a | -40.23% | 18.48% | 52.8% | 0.79% | 5.45% |
| Avg. Price | $64.43 | $148.58 | $152.33 | $272.37 | $300.18 | $384.17 |
| P/E Ratio | 17.8 | 68.79 | 59.97 | 70.56 | 77.17 | 93.93 |
| Free Cash Flow (M) | $655 | $810 | $1,036 | $1,247 | $1,118 | $1,587 |
| CAPEX (M) | $75 | $95 | $65 | $102 | $143 | $142 |
| EV / EBITDA | 31.9 | 57.19 | 49.06 | 55.64 | 56.33 | 65.35 |
| Total Debt (M) | $346 | $347 | $348 | $649 | $2,476 | $2,480 |
| Net Debt / EBITDA | -0.65 | -0.94 | -0.63 | -0.27 | -0.12 | -0.33 |
| Current Ratio | 1.74 | 1.7 | 1.27 | 1.24 | 2.93 | 2.86 |
Cadence Design Systems has rapidly growing revenues and increasing reinvestment in the business, strong operating margins with a stable trend, and generally positive cash flows. The company also benefits from an excellent current ratio of 2.86, positive EPS growth, and healthy leverage levels.
Cadence Design Systems's Valuation Is in Line With Its Sector Averages:
Cadence Design Systems has a trailing twelve month P/E ratio of 87.3, compared to an average of 30.44 for the Technology sector. Based on its EPS guidance of $9.39, the company has a forward P/E ratio of 40.0. Cadence Design Systems's PEG ratio is 7.46 on the basis of the 11.7% weighted average of the company and the broader market's EPS compound average growth rates. This suggests that the company's shares are overvalued. Furthermore, Cadence Design Systems is likely overvalued compared to the book value of its equity, since its P/B ratio of 13.68 is higher than the sector average of 4.19. The company's shares are currently trading 661.1% below their Graham number. Ultimately, Cadence Design Systems's strong cash flows, decent earnings multiple, and healthy debt levels factor towards it being fairly valued, its elevated P/B ratio notwithstanding.
There's an Analyst Consensus of Some Upside Potential for Cadence Design Systems:
The 26 analysts following Cadence Design Systems have set target prices ranging from $275.0 to $470.0 per share, for an average of $394.79 with a buy rating.
Cadence Design Systems has an average amount of shares sold short because 2.2% of the company's shares are sold short. Institutions own 92.4% of the company's shares, and the insider ownership rate stands at 0.29%, suggesting a small amount of insider investors. The largest shareholder is Blackrock Inc., whose 9% stake in the company is worth $8,285,241,574.