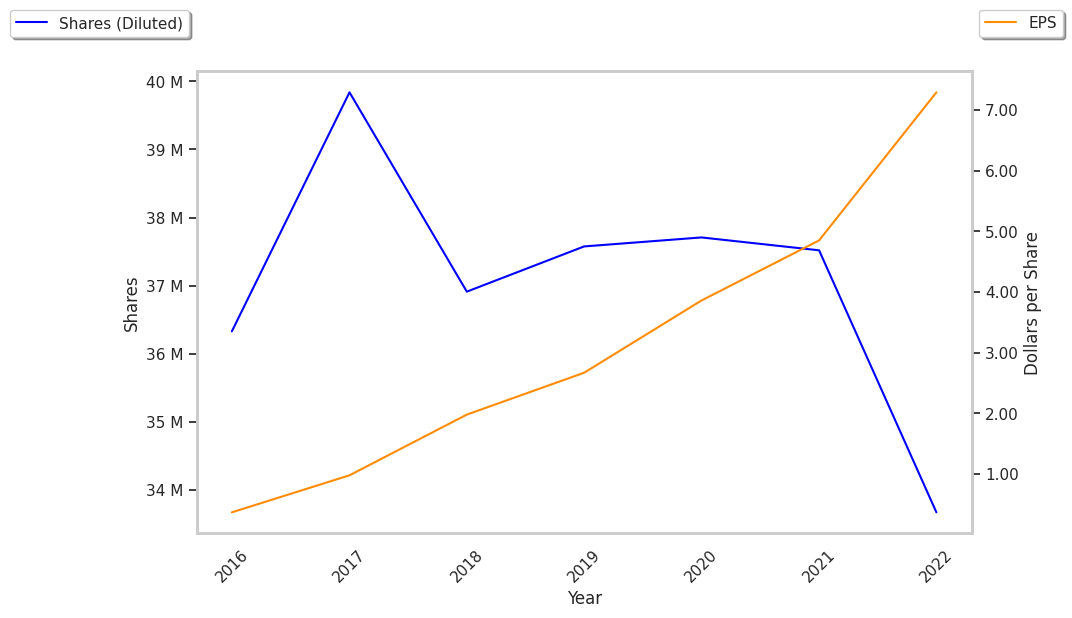
Medpace logged a 15.0% change during today's morning session, and is now trading at a price of $607.45 per share.
Medpace returned gains of 15.9% last year, with its stock price reaching a high of $677.9 and a low of $373.0. Over the same period, the stock underperformed the S&P 500 index by -1.9%. The company's 50-day average price was $480.87. Medpace Holdings, Inc. provides clinical research-based drug and medical device development services in North America, Europe, Asia, South America, Africa, and Australia. Based in Cincinnati, OH, the Large-Cap Health Care company has 6,200 full time employees. Medpace has not offered a dividend during the last year.
Strong Revenue Growth but Not Enough Current Assets to Cover Current Liabilities:
| 2020 | 2021 | 2022 | 2023 | 2024 | 2025 | |
|---|---|---|---|---|---|---|
| Revenue (M) | $926 | $1,142 | $1,460 | $1,886 | $2,109 | $2,530 |
| Operating Margins | 18% | 17% | 19% | 18% | 21% | 21% |
| Net Margins | 16% | 16% | 17% | 15% | 19% | 18% |
| Net Income (M) | $145 | $182 | $245 | $283 | $404 | $451 |
| Net Interest Expense (M) | $0 | -$0 | -$3 | -$0 | $25 | $13 |
| Depreciation & Amort. (M) | $12 | $16 | $19 | $24 | $28 | $27 |
| Diluted Shares (M) | 15 | 15 | 18 | 24 | 24 | 30 |
| Earnings Per Share | $9.51 | $11.9 | $13.31 | $12.0 | $17.07 | $15.28 |
| EPS Growth | n/a | 25.13% | 11.85% | -9.84% | 42.25% | -10.49% |
| Avg. Price | $103.6 | $179.67 | $154.82 | $306.53 | $332.78 | $538.23 |
| P/E Ratio | 14.08 | 19.34 | 12.17 | 24.9 | 18.73 | 26.9 |
| Free Cash Flow (M) | $227 | $235 | $351 | $397 | $572 | $682 |
| CAPEX (M) | $31 | $28 | $37 | $37 | $37 | $31 |
| EV / EBITDA | 9.9 | 14.23 | 10.27 | 18.83 | 14.55 | 20.7 |
| Total Debt (M) | $0 | $0 | $100 | $0 | $0 | $0 |
| Net Debt / EBITDA | -1.55 | -2.15 | 0.24 | -0.68 | -1.41 | -0.88 |
| Current Ratio | 1.08 | 1.24 | 0.42 | 0.64 | 0.93 | 0.74 |
Medpace benefits from rapidly growing revenues and a flat capital expenditure trend, generally positive cash flows, and decent operating margins with a stable trend. The company's financial statements show positive EPS growth and healthy leverage levels. However, the firm has not enough current assets to cover current liabilities because its current ratio is 0.74.
Medpace Has Elevated P/B and P/E Ratios:
Medpace has a trailing twelve month P/E ratio of 30.2, compared to an average of 22.94 for the Health Care sector. Based on its EPS guidance of $18.78, the company has a forward P/E ratio of 25.6. The 10.2% compound average growth rate of Medpace's historical and projected earnings per share yields a PEG ratio of 2.96. This suggests that these shares are overvalued. Furthermore, Medpace is likely overvalued compared to the book value of its equity, since its P/B ratio of 37.54 is higher than the sector average of 3.19. The company's shares are currently trading 730.9% below their Graham number. Overall, Medpace's lofty valuation in terms of earnings and assets is to some extent attenuated by its strong cash flow trend and reasonable levels of debt.
Medpace Has an Average Rating of Hold:
The 12 analysts following Medpace have set target prices ranging from $329.0 to $586.0 per share, for an average of $472.33 with a hold rating.
Medpace has an above average percentage of its shares sold short because 9.2% of the company's shares are sold short. Institutions own 87.2% of the company's shares, and the insider ownership rate stands at 19.43%, suggesting a large amount of insider shareholders. The largest shareholder is Blackrock Inc., whose 9% stake in the company is worth $1,500,656,443.