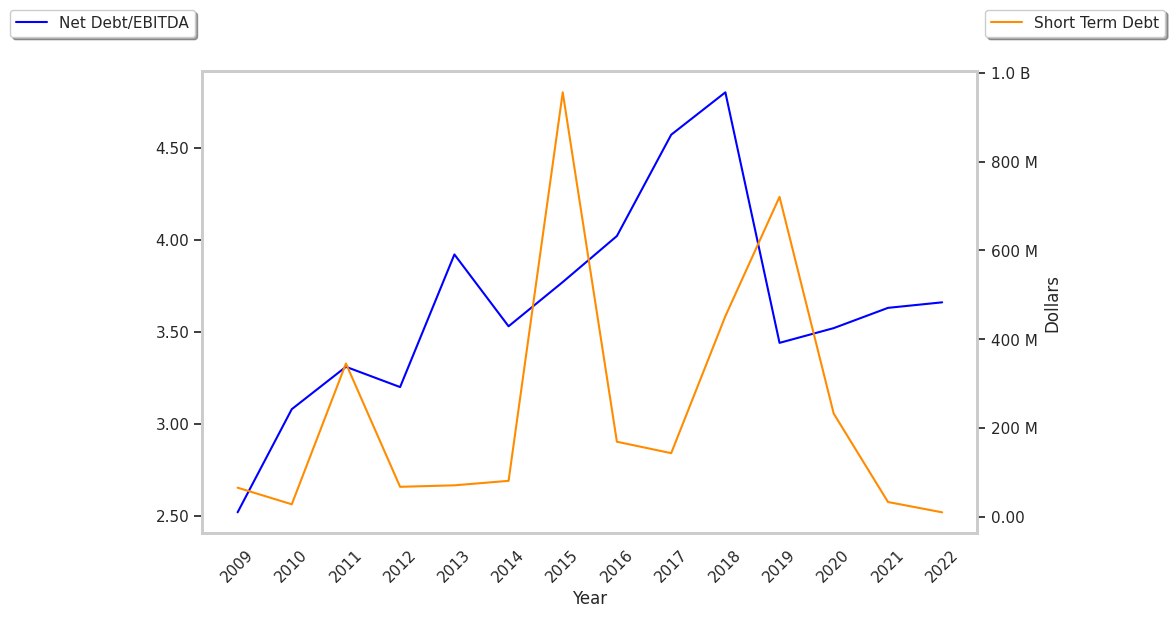
Specialty Real Estate Investment Trust company Equinix is standing out today, surging to $1099.03 and marking a 6.3% change. In comparison the S&P 500 moved only -0.0%. EQIX is -8.39% below its average analyst target price of $1199.66, which implies there is more upside for the stock.
As such, the average analyst rates it at buy. Over the last year, Equinix shares have outperformed the S&P 500 by 13.0%, with a price change of 29.0%.
Equinix, Inc. shortens the path to boundless connectivity anywhere in the world. The company is classified within the real estate sector, which includes REITs (Real Estate Investment Trusts, and real estate services and development companies. The sector’s value and performance is, for obvious reasons, strongly correlated with the value of real estate, but some real estate companies, which provide only services for example, may show some resistance to cycles within the real estate market.
Equinix's trailing 12 month P/E ratio is 76.0, based on its trailing EPS of $14.47. The company has a forward P/E ratio of 56.9 according to its forward EPS of $19.31 -- which is an estimate of what its earnings will look like in the next quarter.
The P/E ratio is the company's share price divided by its earnings per share. In other words, it represents how much investors are willing to spend for each dollar of the company's earnings (revenues minus the cost of goods sold, taxes, and overhead). As of the third quarter of 2024, the real estate sector has an average P/E ratio of 27.31, and the average for the S&P 500 is 29.3.
EQIX’s price to earnings ratio can be divided by its projected five-year growth rate, to give us the price to earnings, or PEG ratio. This allows us to put its earnings valuation in the context of its growth expectations which is useful because companies with low P/E ratios often have low growth, which means they actually do not present an attractive value.
When we perform the calculation for Equinix, we obtain a PEG ratio of 3.35, which indicates that the company is overvalued compared to its growth prospects. The weakness with PEG ratios is that they rely on expected growth estimates, which of course may not turn out as expected.
Another key to assessing a company's health is to look at its free cash flow, which is calculated on the basis of its total cash flow from operating activities minus its capital expenditures. Capital expenditures are the costs of maintaining fixed assets such as land, buildings, and equipment. From Equinix's last four annual reports, we are able to obtain the following rundown of its free cash flow:
| Date Reported | Cash Flow from Operations ($ k) | Capital expenditures ($ k) | Free Cash Flow ($ k) | YoY Growth (%) |
|---|---|---|---|---|
| 2025 | 3,911,000 | 4,311,000 | -400,000 | -318.58 |
| 2024 | 3,249,000 | 3,066,000 | 183,000 | -58.03 |
| 2023 | 3,217,000 | 2,781,000 | 436,000 | -36.35 |
| 2022 | 2,963,000 | 2,278,000 | 685,000 | 435.28 |
| 2021 | 2,547,206 | 2,751,512 | -204,306 | -847.77 |
| 2020 | 2,309,826 | 2,282,504 | 27,322 |
- Average free cash flow: $121.17 Million
- Average free cash flown growth rate: -13.5 %
- Coefficient of variability (the lower the better): 0.0 %
The balance of cash flows represents the capital that is available for re-investment in the business, or for payouts to equity investors as dividends. A negative cash flow is common, even among successful companies. But if EQIX's free cash flow continues on its negative trend, it may not be able to sustain its dividend payments, which over the last 12 months has yielded 1.9% to investors. Cutting the dividend can compound a company's problems by causing investors to sell their shares, which further pushes down its stock price.
Another valuation metric for analyzing a stock is its Price to Book (P/B) Ratio, which consists in its share price divided by its book value per share. The book value refers to the present liquidation value of the company, as if it sold all of its assets and paid off all debts.
Equinix's P/B ratio indicates that the market value of the company exceeds its book value by a factor of 7, so the company's assets may be overvalued compared to the average P/B ratio of the Real Estate sector, which stands at 1.94 as of the third quarter of 2024.
With a higher P/E ratio than its sector average, a higher than Average P/B Ratio, and positive cash flows with a downwards trend, we can conclude that Equinix is probably overvalued at current prices. The stock presents mixed growth prospects because of its weak operating margins with a stable trend, and an inflated PEG ratio.