It's been a great morning session for IDEXX Laboratories investors, who saw their shares rise 3.7% to a price of $588.91 per share. At these higher prices, is the company still fairly valued? If you are thinking about investing, make sure to check the company's fundamentals before making a decision.
IDEXX Laboratories Has Elevated P/B and P/E Ratios:
IDEXX Laboratories, Inc. develops, manufactures, and distributes products for the companion animal veterinary, livestock and poultry, dairy, and water testing industries in the United States and internationally. The company belongs to the Health Care sector, which has an average price to earnings (P/E) ratio of 22.94 and an average price to book (P/B) ratio of 3.19. In contrast, IDEXX Laboratories has a trailing 12 month P/E ratio of 42.7 and a P/B ratio of 29.99.
IDEXX Laboratories's PEG ratio is 3.58, which shows that the stock is probably overvalued in terms of its estimated growth. For reference, a PEG ratio near or below 1 is a potential signal that a company is undervalued.
Generally Positive Cash Flows but an Average Current Ratio:
| 2020 | 2021 | 2022 | 2023 | 2024 | 2025 | |
|---|---|---|---|---|---|---|
| Revenue (M) | $2,707 | $3,215 | $3,367 | $3,661 | $3,898 | $4,304 |
| Gross Margins | 58% | 59% | 60% | 60% | 61% | 62% |
| Net Margins | 21% | 23% | 20% | 23% | 23% | 25% |
| Net Income (M) | $582 | $745 | $679 | $845 | $888 | $1,059 |
| Net Interest Expense (M) | -$33 | -$29 | -$39 | -$36 | $34 | $38 |
| Depreciation & Amort. (M) | $96 | $105 | $112 | $115 | $130 | $145 |
| Diluted Shares (M) | 87 | 87 | 85 | 84 | 83 | 81 |
| Earnings Per Share | $6.71 | $8.6 | $8.03 | $10.06 | $10.67 | $13.08 |
| EPS Growth | n/a | 28.17% | -6.63% | 25.28% | 6.06% | 22.59% |
| Avg. Price | $342.76 | $589.4 | $463.24 | $555.05 | $411.94 | $563.57 |
| P/E Ratio | 50.26 | 67.59 | 57.47 | 54.47 | 38.54 | 43.25 |
| Free Cash Flow (M) | $541 | $636 | $394 | $773 | $808 | $1,057 |
| CAPEX (M) | $107 | $120 | $149 | $134 | $121 | $125 |
| EV / EBITDA | 38.75 | 50.0 | 39.95 | 38.68 | 27.82 | 30.63 |
| Total Debt (M) | $1,768 | $1,626 | $1,464 | $1,321 | $1,068 | $450 |
| Net Debt / EBITDA | 1.75 | 1.43 | 1.34 | 0.72 | 0.62 | 0.18 |
| Current Ratio | 1.82 | 1.25 | 0.89 | 1.57 | 1.31 | 1.23 |
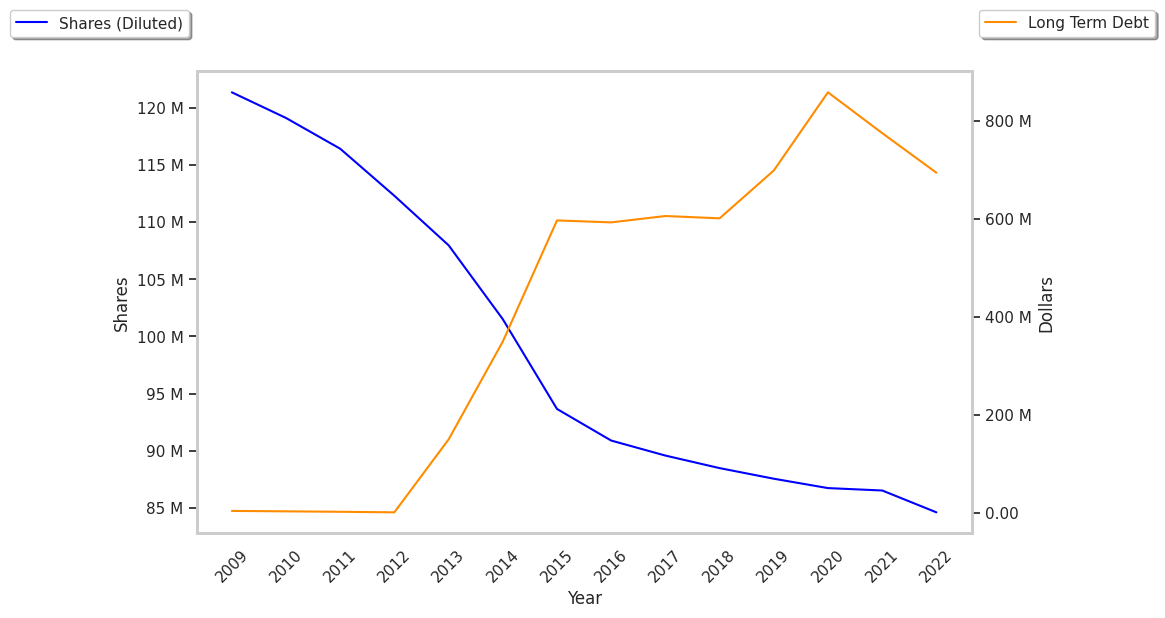
IDEXX Laboratories has generally positive cash flows and growing revenues and a flat capital expenditure trend. Additionally, the company's financial statements display a strong EPS growth trend and healthy leverage levels. Furthermore, IDEXX Laboratories has similar gross margins to its peers and just enough current assets to cover current liabilities, as shown by its current ratio of 1.23.