Now trading at a price of $294.07, Assurant has moved 4.5% so far today.
Assurant returned gains of 34.4% last year, with its stock price reaching a high of $302.29 and a low of $195.57. Over the same period, the stock outperformed the S&P 500 index by 14.7%. More recently, the company's 50-day average price was $266.72. Assurant, Inc. provides protection services to connected devices, homes, and automobiles in North America, Latin America, Europe, and the Asia Pacific. Based in Atlanta, GA, the Large-Cap Finance company has 14,800 full time employees. Assurant has offered a 1.2% dividend yield over the last 12 months.
Growing Revenues and Good EPS Growth:
| 2020 | 2021 | 2022 | 2023 | 2024 | 2025 | |
|---|---|---|---|---|---|---|
| Revenue (M) | $9,598 | $10,188 | $10,193 | $11,132 | $11,878 | $12,814 |
| Interest Income (M) | $104 | $112 | $108 | $108 | $107 | $110 |
| Operating Margins | 6% | 8% | 3% | 7% | 8% | 8% |
| Net Margins | 5% | 13% | 3% | 6% | 6% | 7% |
| Net Income (M) | $441 | $1,362 | $277 | $642 | $760 | $873 |
| Depreciation & Amort. (M) | $56 | $74 | $86 | $109 | $139 | $156 |
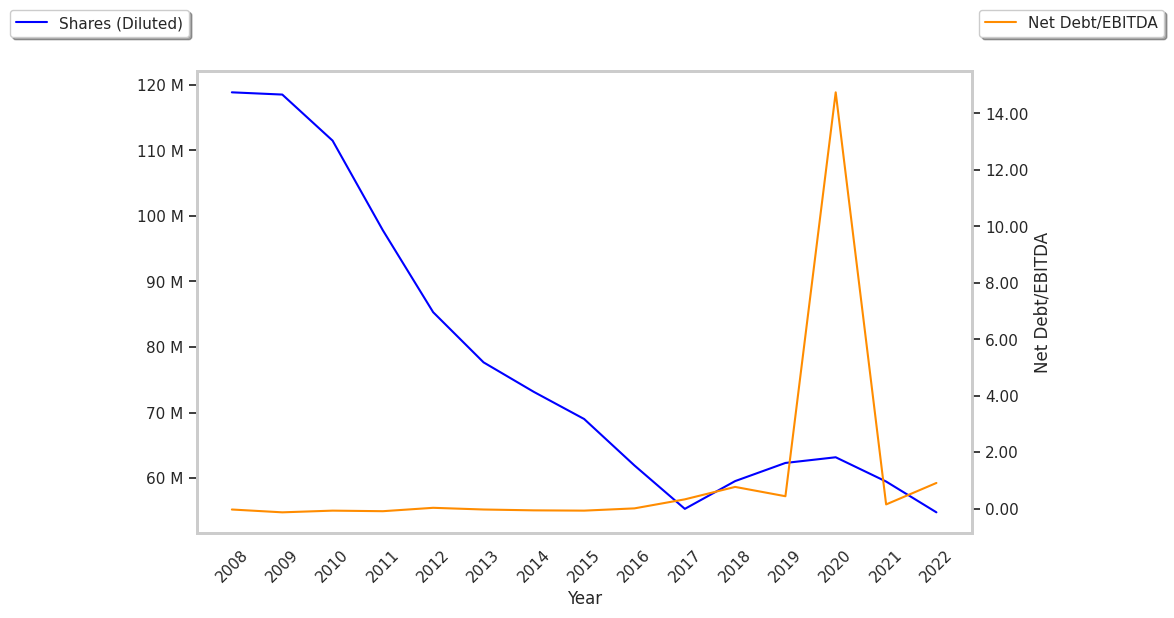
| Diluted Shares (M) | 63 | 60 | 55 | 53 | 52 | 51 |
| Earnings Per Share | $6.98 | $22.66 | $5.05 | $11.95 | $14.46 | $16.93 |
| EPS Growth | n/a | 224.64% | -77.71% | 136.63% | 21.0% | 17.08% |
| Avg. Price | $111.28 | $147.39 | $168.33 | $168.49 | $213.34 | $278.89 |
| P/E Ratio | 15.85 | 6.42 | 33.07 | 14.02 | 14.66 | 16.27 |
| Free Cash Flow (M) | $1,221 | $594 | $411 | $936 | $1,111 | $1,598 |
| CAPEX (M) | $121 | $187 | $186 | $202 | $221 | $236 |
| EV / EBITDA | 10.5 | 10.29 | 22.65 | 10.23 | 10.65 | 11.69 |
| Total Debt (M) | $2,208 | $2,202 | $2,130 | $2,081 | $2,083 | $2,207 |
| Net Debt / EBITDA | -0.0 | 0.19 | 1.36 | 0.49 | 0.26 | 0.3 |
Assurant has growing revenues and increasing reinvestment in the business and generally positive cash flows. Additionally, the company's financial statements display low leverage levels and a strong EPS growth trend. Furthermore, Assurant has weak operating margins with a stable trend.
a Very Low P/E Ratio but Priced at a Premium:
Assurant has a trailing twelve month P/E ratio of 12.8, compared to an average of 15.92 for the Finance sector. Based on its EPS guidance of $22.5, the company has a forward P/E ratio of 11.9. According to the 18.2% compound average growth rate of Assurant's historical and projected earnings per share, the company's PEG ratio is 0.7. Taking the weighted average of the company's EPS CAGR and the broader market's 5-year projected EPS growth rate, we obtain a normalized growth rate of 13.0%. On this basis, the company's PEG ratio is 0.98. This suggests that its shares are undervalued. In contrast, Assurant is likely overvalued compared to the book value of its equity, since its P/B ratio of 2.49 is higher than the sector average of 1.78. The company's shares are currently trading 40.5% below their Graham number.
Assurant Has an Average Rating of Buy:
The 6 analysts following Assurant have set target prices ranging from $274.0 to $310.0 per share, for an average of $293.0 with a buy rating.
Assurant has an average amount of shares sold short because 4.0% of the company's shares are sold short. Institutions own 98.0% of the company's shares, and the insider ownership rate stands at 0.71%, suggesting a small amount of insider investors. The largest shareholder is Bank Of New York Mellon Corporation, whose 10% stake in the company is worth $1,416,544,924.