
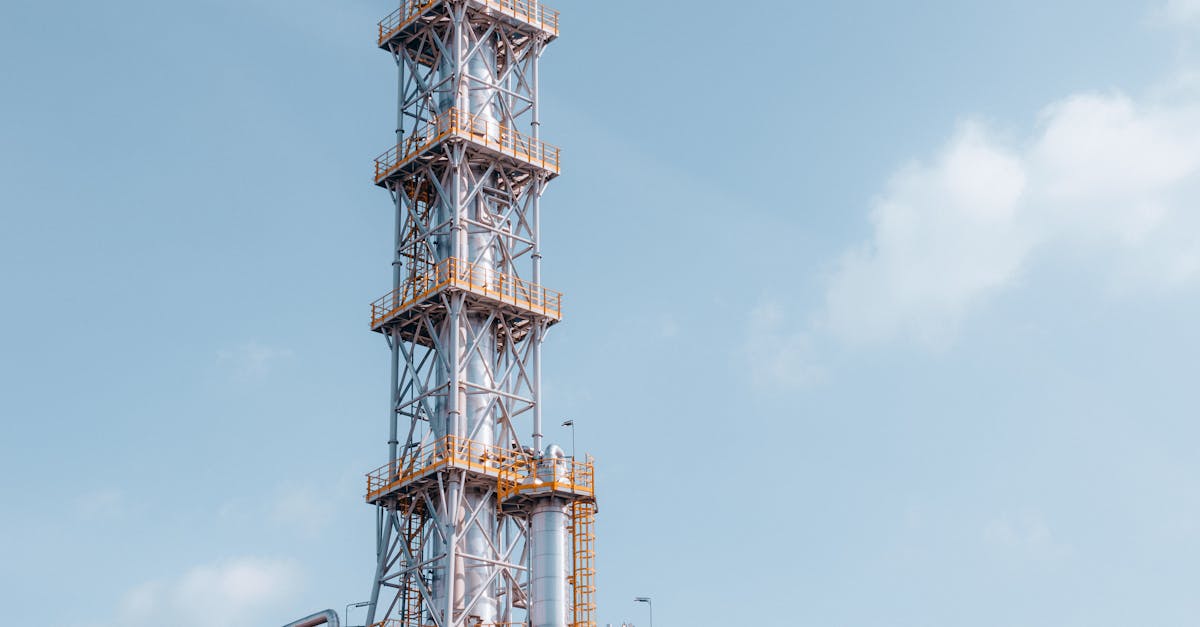
PAR PACIFIC HOLDINGS, INC. recently released its 10-Q report. The Houston-based company, incorporated in 1984 and formerly known as Par Petroleum Corporation until its 2015 name change, operates in three segments: Refining, Retail, and Logistics. Its refining business turns crude oil into gasoline, distillate, asphalt, and other products; its retail network sells fuel and convenience-store merchandise under the Hele, 76, and nomnom brands; and its logistics assets move and store ethanol, petroleum, and refined products through terminals, pipelines, trucking, marine, rail, and storage facilities.
Item 2 shows how much the quarter was shaped by the Wyoming refinery’s outage. The refinery was safely idled after an operational incident on February 12, 2025 and did not return to full crude operations until late April 2025, creating 66 days of idle time that affected year-over-year comparisons. At the same time, crude markets were firmer: Brent averaged $96.68 a barrel in the second quarter of 2026 and $87.58 for the first six months, versus $66.71 and $70.82 a year earlier, while average U.S. retail gasoline prices rose to $3.80 a gallon in the first half of 2026 from $3.25 in the first half of 2025.
The company’s earnings swung sharply higher. Net income attributable to Par Pacific stockholders rose to $462.1 million in the second quarter of 2026 from $59.5 million a year earlier, and to $516.6 million for the first half from $29.1 million. Adjusted EBITDA climbed to $571.3 million in the quarter from $137.8 million, and to $662.8 million for six months from $148.0 million.
Refining was the main driver. Refining operating income jumped to $629.9 million in the second quarter from $81.3 million a year earlier, and to $686.2 million for the first half from $56.6 million. Refining adjusted gross margin per barrel reached $41.22 in the quarter, up from $13.65, and $26.17 for six months, up from $10.24.
The segment’s throughput and sales volumes were mixed. Total refining feedstocks throughput was 181.4 thousand barrels per day in the quarter, down from 186.6 thousand a year earlier, while refined product sales volume was 201.3 thousand barrels per day versus 204.5 thousand. For the first half, throughput was 182.7 thousand barrels per day compared with 181.4 thousand, and sales volume was 195.1 thousand barrels per day versus 194.6 thousand.
By refinery, Hawaii processed 73.2 thousand barrels per day in the quarter, down from 88.1 thousand, and posted an adjusted gross margin of $57.00 per barrel versus $10.18. Montana throughput rose to 52.7 thousand barrels per day from 44.2 thousand, with adjusted gross margin at $37.22 per barrel versus $22.30. Washington throughput was 41.2 thousand barrels per day, up slightly from 40.8 thousand, with adjusted gross margin of $20.31 per barrel versus $11.47. Wyoming throughput was 14.3 thousand barrels per day, up from 13.5 thousand, after the outage-related recovery period.
Revenue also moved higher across the company. Second-quarter revenue was $3.0 billion, up from $1.9 billion, and first-half revenue was $4.8 billion, up from $3.6 billion. Cost of revenues increased to $2.1 billion in the quarter from $1.6 billion, while operating income rose to $634.6 million from $96.8 million. Interest expense and financing costs, net, fell to $14.3 million from $22.1 million in the quarter and to $30.2 million from $44.0 million in the first half, though debt extinguishment and commitment costs added $11.5 million in each period. Retail operating income slipped to $14.6 million in the quarter from $20.8 million, but improved to $27.6 million for the first half from $36.8 million. Today the company's shares have moved -12.08% to a price of $72.97. For the full picture, make sure to review PAR PACIFIC HOLDINGS, INC.'s 10-Q report.
