ONEOK shares fell by -1.7% during the day's evening session, and are now trading at a price of $66.06. Is it time to buy the dip? To better answer that question, it's essential to check if the market is valuing the company's shares fairly in terms of its earnings and equity levels.
ONEOK Is Reasonably Valued:
ONEOK, Inc. engages in gathering, processing, fractionation, storage, transportation, and marketing of natural gas and natural gas liquids (NGL) in the United States. The company belongs to the Utilities sector, which has an average price to earnings (P/E) ratio of 17.53 and an average price to book (P/B) ratio of 1.71. In contrast, ONEOK has a trailing 12 month P/E ratio of 12.1 and a P/B ratio of 2.36.
P/E rations can be placed into context by dividing them by the firm's expected 5-year EPS growth rate, which gives us its Price to Earnings Growth (PEG) ratio. ONEOK's PEG ratio is 1.06, which tells us the company is fairly valued in terms of growth. PEG ratios under 1 are considered an indicator of undervalued growth, but we need to keep in mind that many successful companies with excellent share performance have maintained much higher PEG ratios.
As always, a quantitative approach to a stock should be supplemented with a look at qualitative factors, such as the competence of its management team, quality of its corporate culture, and the wide variety of social and economic factors that can impact the success of its product.
The Business Has Weak Operating Margins:
| 2018 | 2019 | 2020 | 2021 | 2022 | 2023 | |
|---|---|---|---|---|---|---|
| Revenue (MM) | $12,593 | $10,164 | $8,542 | $16,540 | $22,387 | $19,199 |
| Revenue Growth | n/a | -19.29% | -15.96% | 93.63% | 35.35% | -14.24% |
| Operating Margins | 15% | 19% | 16% | 16% | 13% | 19% |
| Net Margins | 12% | 16% | 9% | 9% | 8% | 13% |
| Net Income (MM) | $1,515 | $1,651 | $802 | $1,500 | $1,722 | $2,456 |
| Net Interest Expense (MM) | $470 | $492 | $713 | $733 | $676 | $727 |
| Depreciation & Amort. (MM) | $429 | $477 | $579 | $622 | $626 | $666 |
| Earnings Per Share | $2.78 | $3.07 | $1.42 | $3.35 | $3.84 | $5.46 |
| EPS Growth | n/a | 10.43% | -53.75% | 135.92% | 14.63% | 42.19% |
| Diluted Shares (MM) | 414 | 415 | 432 | 447 | 448 | 460 |
| Free Cash Flow (MM) | $45 | -$1,902 | -$296 | $1,849 | $1,704 | $2,645 |
| Capital Expenditures (MM) | $2,141 | $3,848 | $2,195 | $697 | $1,202 | $1,308 |
| Current Ratio | 0.66 | 0.73 | 1.39 | 0.75 | 0.84 | 0.97 |
| Total Debt (MM) | $9,073 | $12,709 | $14,681 | $14,104 | $13,621 | $21,950 |
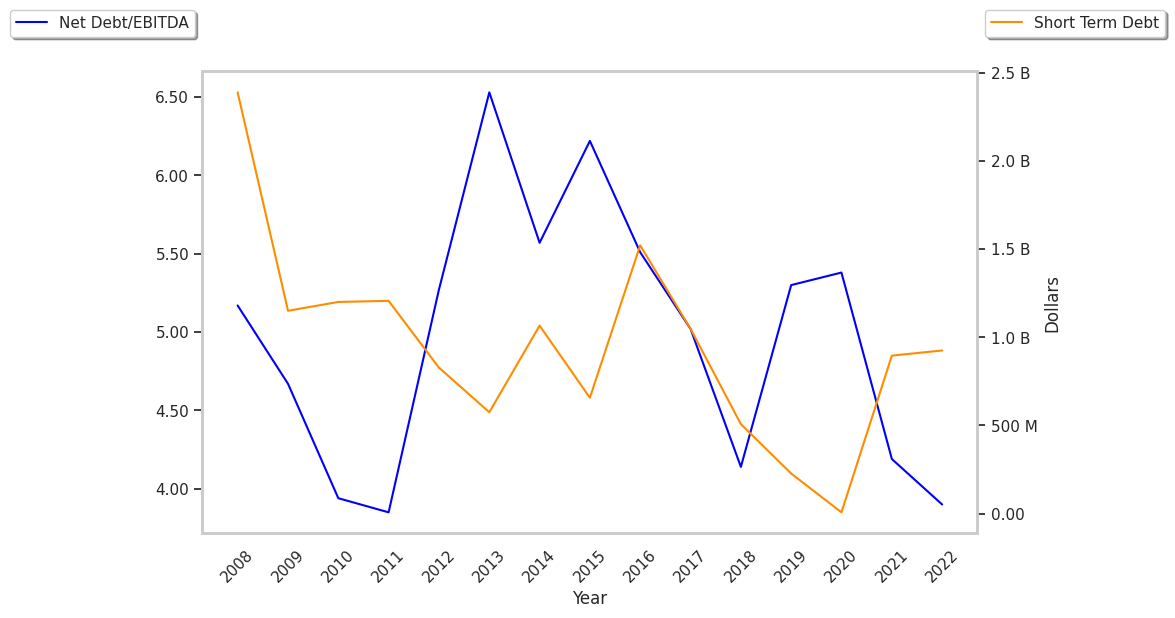
| Net Debt / EBITDA | 4.0 | 5.31 | 7.3 | 4.34 | 3.9 | 4.93 |
ONEOK has growing revenues and decreasing reinvestment in the business, a strong EPS growth trend, and irregular cash flows. However, the firm suffers from weak operating margins with a stable trend and a highly leveraged balance sheet.