It's been a great evening session for Fidelity National Information Services investors, who saw their shares rise 1.5% to a price of $77.51 per share. At these higher prices, is the company still fairly valued? If you are thinking about investing, make sure to check the company's fundamentals before making a decision.
Fidelity National Information Services's Valuation Is in Line With Its Sector Averages:
Fidelity National Information Services, Inc. engages in the provision of financial services technology solutions for financial institutions, businesses, and developers worldwide. The company belongs to the Consumer Discretionary sector, which has an average price to earnings (P/E) ratio of 22.06 and an average price to book (P/B) ratio of 3.18. In contrast, Fidelity National Information Services has a trailing 12 month P/E ratio of 107.7 and a P/B ratio of 2.42.
When we divide Fidelity National Information Services's P/E ratio by its expected EPS growth rate of the next five years, we obtain its PEG ratio of -25.67. Since it's negative, the company has negative growth expectations, and most investors will probably avoid the stock unless it has an exceptionally low P/E and P/B ratio.
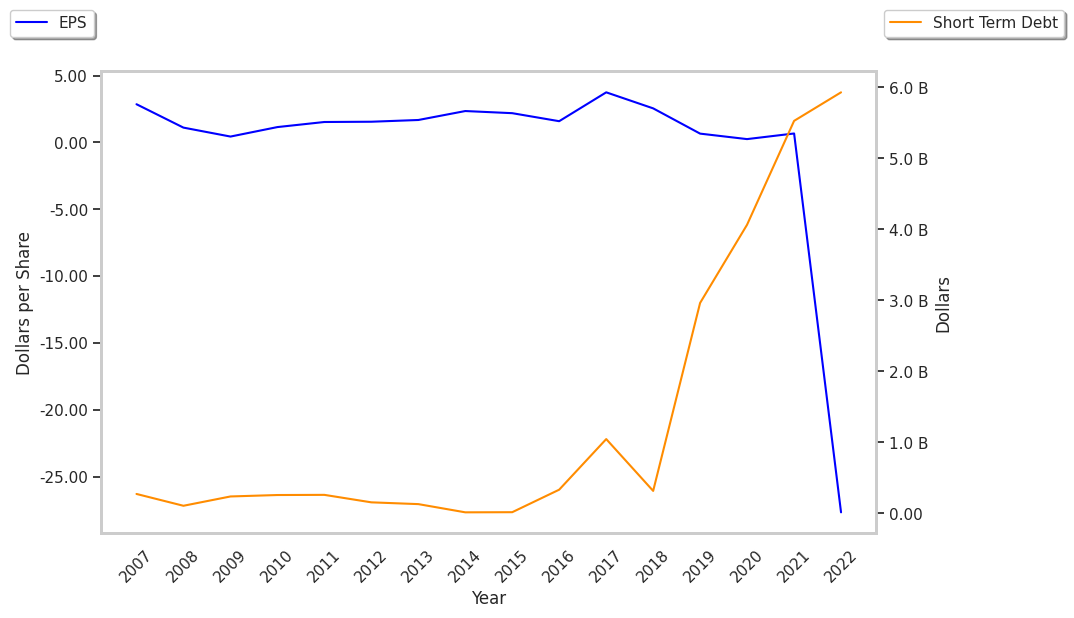
The Business Is Unprofitable and Its Balance Sheet Is Highly Leveraged:
| 2018 | 2019 | 2020 | 2021 | 2022 | 2023 | |
|---|---|---|---|---|---|---|
| Revenue (M) | $8,423 | $10,333 | $12,552 | $9,339 | $9,719 | $9,821 |
| Gross Margins | 34% | 36% | 33% | 36% | 36% | 37% |
| Net Margins | 10% | 3% | 1% | 4% | -172% | -68% |
| Net Income (M) | $846 | $303 | $158 | $417 | -$16,720 | -$6,654 |
| Net Interest Expense (M) | $314 | $389 | $339 | $214 | $298 | $713 |
| Depreciation & Amort. (M) | $1,420 | $2,444 | $3,714 | $4,015 | $3,846 | $2,675 |
| Diluted Shares (M) | 332 | 451 | 627 | 621 | 593 | 591 |
| Earnings Per Share | $2.55 | $0.66 | $0.25 | $0.67 | -$27.68 | -$11.26 |
| EPS Growth | n/a | -74.12% | -62.12% | 168.0% | -4231.34% | 59.32% |
| Avg. Price | $95.0 | $114.8 | $131.55 | $126.75 | $98.04 | $77.51 |
| P/E Ratio | 36.82 | 171.34 | 505.96 | 186.4 | -3.54 | -6.88 |
| Free Cash Flow (M) | $1,866 | $2,210 | $4,179 | $4,490 | $3,671 | $4,193 |
| CAPEX (M) | $127 | $200 | $263 | $320 | $268 | $142 |
| EV / EBITDA | 16.71 | 20.62 | 26.02 | 21.04 | 17.32 | 17.23 |
| Total Debt (M) | $17,340 | $34,458 | $31,902 | $29,650 | $28,413 | $25,940 |
| Net Debt / EBITDA | 5.78 | 9.76 | 7.02 | 5.47 | 5.52 | 6.16 |
| Current Ratio | 1.19 | 0.84 | 0.8 | 0.74 | 0.79 | 0.75 |
Fidelity National Information Services's financial statements include several red flags such as slimmer gross margins than its peers, declining EPS growth, and not enough current assets to cover current liabilities because its current ratio is 0.75. Additionally, the firm has a highly leveraged balance sheet. On the other hand, the company has generally positive cash flows working in its favor. Furthermore, Fidelity National Information Services has slight revenue growth and a flat capital expenditure trend.