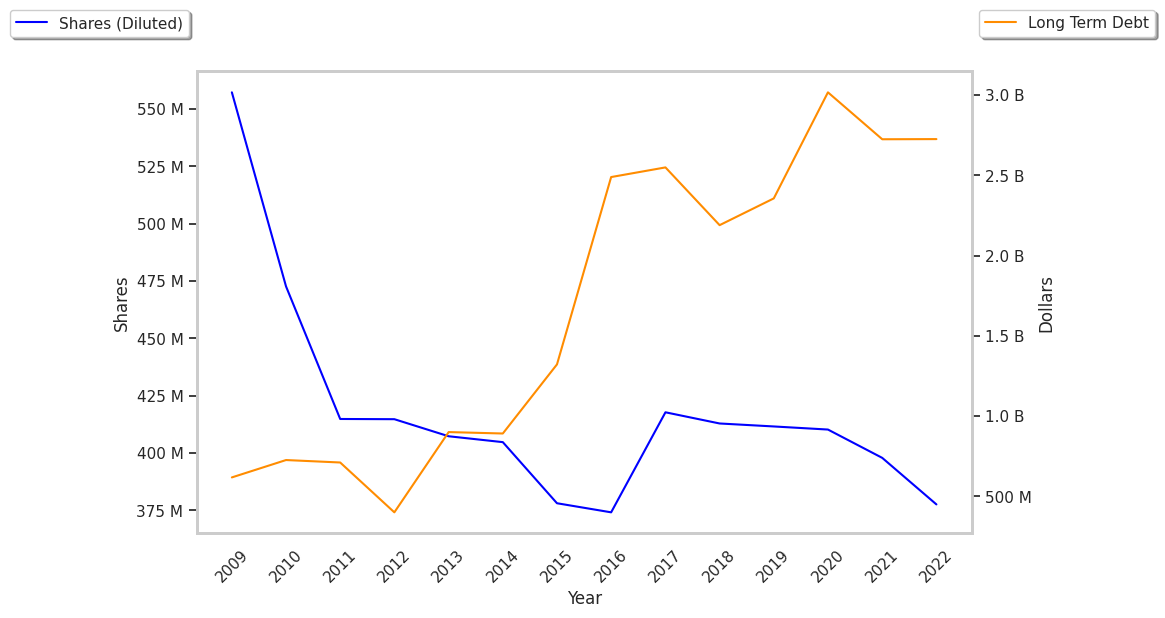
Property & Casualty Insurance company Arch Capital is taking Wall Street by surprise today, falling to $91.4 and marking a -4.2% change compared to the S&P 500, which moved -0.0%. ACGL is -16.09% below its average analyst target price of $108.92, which implies there is more upside for the stock.
As such, the average analyst rates it at buy. Over the last year, Arch Capital has underperfomed the S&P 500 by -25.1%, moving 2.6%.
Arch Capital Group Ltd., together with its subsidiaries, provides insurance, reinsurance, and mortgage insurance products in the United States, Canada, Bermuda, the United Kingdom, Europe, and Australia. The company is part of the financial services sector, alongside a staggering variety of banking, mortgage, insurance,and credit service companies. If there is one common denominator among all companies in the sector, it’s that they are all dedicated to maintaining and developing new systems for the storage and transfer of value and risk.
Arch Capital's trailing 12 month P/E ratio is 7.0, based on its trailing EPS of $13.0. The company has a forward P/E ratio of 9.2 according to its forward EPS of $9.9 -- which is an estimate of what its earnings will look like in the next quarter. As of the third quarter of 2024, the average Price to Earnings (P/E) ratio for US finance companies is 15.92, and the S&P 500 has an average of 29.3. The P/E ratio consists in the stock's share price divided by its earnings per share (EPS), representing how much investors are willing to spend for each dollar of the company's earnings. Earnings are the company's revenues minus the cost of goods sold, overhead, and taxes.
It’s important to put the P/E ratio into context by dividing it by the company’s projected five-year growth rate. This results in the Price to Earnings Growth, or PEG ratio. Companies with comparatively high P/E ratios may still have a reasonable PEG ratio if their expected growth is strong. On the other hand, a company with low P/E ratios may not be of value to investors if it has low projected growth.
Arch Capital's PEG ratio of 1.05 indicates that its P/E ratio is fair compared to its projected earnings growth. Insofar as its projected earnings growth rate turns out to be true, the company is probably fairly valued by this metric.
To deepen our understanding of the company's finances, we should study the effect of its depreciation and capital expenditures on the company's bottom line. We can see the effect of these additional factors in Arch Capital's free cash flow, which was $6.13 Billion as of its most recent annual report. This represents the amount of money that is available for reinvesting in the business, or for paying out to investors in the form of a dividend. With its strong cash flows, ACGL is in a position to do either -- which can encourage more investors to place their capital in the company. Over the last four years, the company's free cash flow has been growing at a rate of 14.5% and has on average been $4.74 Billion.
Value investors often analyze stocks through the lens of its Price to Book (P/B) Ratio (its share price divided by its book value). The book value refers to the present value of the company if the company were to sell off all of its assets and pay all of its debts today - a number whose value may differ significantly depending on the accounting method. Arch capital's P/B ratio indicates that the market value of the company exceeds its book value by a factor of 1.38, but is still below the average P/B ratio of the Finance sector, which stood at 1.78 as of the third quarter of 2024.
Arch Capital is likely fairly valued at today's prices because it has a Very low P/E ratio, a lower P/B ratio than its sector average, and generally positive cash flows with an upwards trend. The stock has strong growth indicators because of its decent operating margins with a stable trend, and a PEG ratio of less than 1. We hope this preliminary analysis will encourage you to do your own research into ACGL's fundamental values -- especially their trends over the last few years, which provide the clearest picture of the company's valuation.