Business Services company Uber Technologies is taking Wall Street by surprise today, falling to $64.14 and marking a -8.0% change compared to the S&P 500, which moved 0.0%. UBER is -27.63% below its average analyst target price of $88.63, which implies there is more upside for the stock.
As such, the average analyst rates it at buy. Over the last year, Uber Technologies has underperfomed the S&P 500 by -24.8%, moving -4.8%.
Uber Technologies, Inc. develops and operates proprietary technology applications in the United States, Canada, Latin America, Europe, the Middle East, Africa, and Asia excluding China and Southeast Asia. The company is a consumer cyclical company, whose sales and revenues correlate with periods of economic expansion and contraction. The reason behind this is that when the economy is growing, the average consumer has more money to spend on the discretionary (non necessary) products that cyclical consumer companies tend to offer. Consumer cyclical stocks may offer more growth potential than non-cyclical or defensive stocks, but at the expense of higher volatility.
Uber Technologies's trailing 12 month P/E ratio is 31.6, based on its trailing EPS of $2.03. The company has a forward P/E ratio of 15.8 according to its forward EPS of $2.36 -- which is an estimate of what its earnings will look like in the next quarter. The P/E ratio is the company's share price divided by its earnings per share. In other words, it represents how much investors are willing to spend for each dollar of the company's earnings (revenues minus the cost of goods sold, taxes, and overhead). As of the third quarter of 2024, the consumer discretionary sector has an average P/E ratio of 22.6, and the average for the S&P 500 is 29.3.
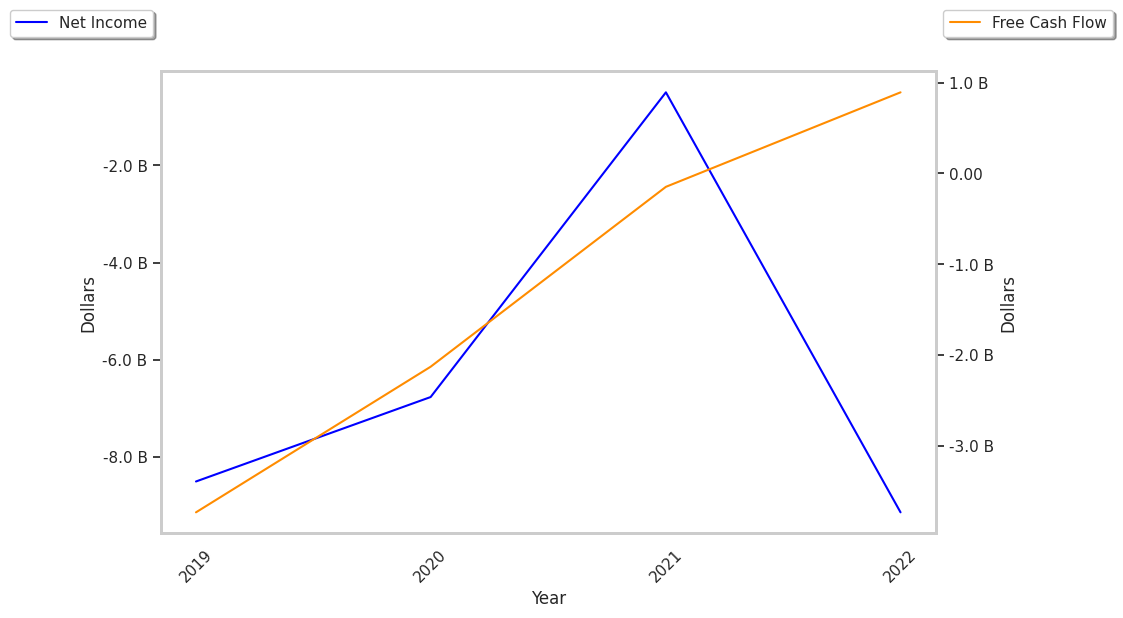
To deepen our understanding of the company's finances, we should study the effect of its depreciation and capital expenditures on the company's bottom line. We can see the effect of these additional factors in Uber Technologies's free cash flow, which was $3.36 Billion as of its most recent annual report. Free cash flow represents the amount of money available for reinvestment in the business or for payments to equity investors in the form of a dividend. In UBER's case the cash flow outlook is weak. It's average cash flow over the last 4 years has been $-1226666666.7 and they've been growing at an average rate of 21.1%.
Another valuation metric for analyzing a stock is its Price to Book (P/B) Ratio, which consists in its share price divided by its book value per share. The book value refers to the present liquidation value of the company, as if it sold all of its assets and paid off all debts). Uber technologies's P/B ratio is 9.13 -- in other words, the market value of the company exceeds its book value by a factor of more than 9, so the company's assets may be overvalued compared to the average P/B ratio of the Consumer Discretionary sector, which stands at 3.19 as of the third quarter of 2024.
Since it has a higher P/E ratio than its sector average, a higher than Average P/B Ratio, and negative cash flows with an upwards trend, Uber Technologies is likely overvalued at today's prices. The company has poor growth indicators because of an inflated PEG ratio and weak operating margins with a stable trend. We hope you enjoyed this overview of UBER's fundamentals. Be sure to check the numbers for yourself, especially focusing on their trends over the last few years.