Now trading at a price of $105.23, Advanced Micro Devices has moved -3.3% so far today.
Advanced Micro Devices returned gains of 88.0% last year, with its stock price reaching a high of $132.83 and a low of $55.71. Over the same period, the stock outperformed the S&P 500 index by 66.0%. More recently, the company's 50-day average price was $105.78. Advanced Micro Devices, Inc. operates as a semiconductor company worldwide. Based in Santa Clara, CA, the large-cap Technology company has 25,000 full time employees. Advanced Micro Devices has not offered a dividend during the last year.
The Company Has a Positive Net Current Asset Value:
| 2018-02-27 | 2019-02-08 | 2020-02-04 | 2021-01-29 | 2022-02-03 | 2023-02-27 | |
|---|---|---|---|---|---|---|
| Revenue (MM) | $5,253 | $6,475 | $6,731 | $9,763 | $16,434 | $23,601 |
| Gross Margins | 34.0% | 38.0% | 43.0% | 45.0% | 48.0% | 45.0% |
| Operating Margins | 1% | 7% | 8% | 14% | 22% | 5% |
| Net Margins | -1.0% | 5.0% | 5.0% | 26.0% | 19.0% | 6.0% |
| Net Income (MM) | -$33 | $337 | $341 | $2,490 | $3,162 | $1,320 |
| Net Interest Expense (MM) | -$126 | -$121 | -$94 | -$47 | -$34 | -$88 |
| Depreciation & Amort. (MM) | -$144 | -$170 | -$222 | -$312 | -$407 | -$4,174 |
| Earnings Per Share | -$0.03 | $0.32 | $0.3 | $2.06 | $2.57 | $0.84 |
| EPS Growth | n/a | 1166.67% | -6.25% | 586.67% | 24.76% | -67.32% |
| Diluted Shares (MM) | 1,039 | 1,064 | 1,120 | 1,207 | 1,230 | 1,571 |
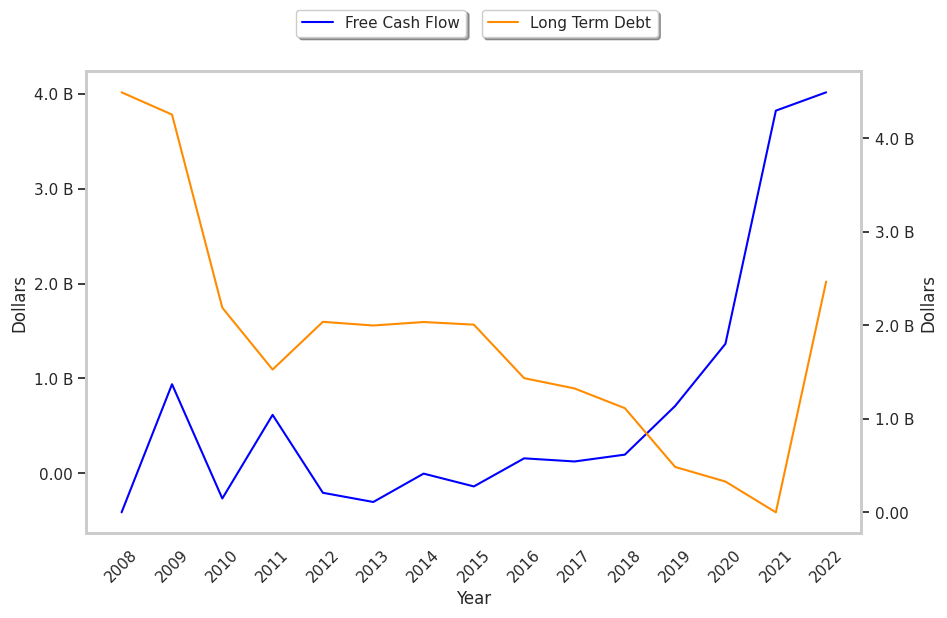
| Free Cash Flow (MM) | $125 | $197 | $710 | $1,365 | $3,822 | $4,015 |
| Capital Expenditures (MM) | -$113 | -$163 | -$217 | -$294 | -$301 | -$450 |
| Net Current Assets (MM) | -$322 | $250 | $1,396 | $3,018 | $3,661 | $2,189 |
| Long Term Debt (MM) | $1,325 | $1,114 | $486 | $330 | $1 | $2,467 |
Advanced Micro Devices has exceptional EPS growth, a pattern of improving cash flows, and an excellent current ratio. However, the firm suffers from slimmer gross margins than its peers and weak operating margins with a positive growth rate. Finally, we note that Advanced Micro Devices has weak revenue growth and a flat capital expenditure trend and an average amount of debt.
Advanced Micro Devices does not have a meaningful trailing P/E ratio since its earnings per share are currently in the red. Based on its EPS guidance of $4.16, the company has a forward P/E ratio of 25.4. In comparison, the average P/E ratio for the Technology sector is 27.16. On the other hand, the market is undervaluing Advanced Micro Devices in terms of its equity because its P/B ratio is 3.08. In comparison, the sector average is 6.23. In conclusion, Advanced Micro Devices's impressive cash flow trend, decent P/B ratio, and reasonable use of leverage demonstrate that the company may still be fairly valued — despite its elevated earnings multiple.
Advanced Micro Devices Has an Average Rating of Buy:
The 38 analysts following Advanced Micro Devices have set target prices ranging from $60.0 to $200.0 per share, for an average of $137.03 with a buy rating. As of April 2023, the company is trading -22.8% away from its average target price, indicating that there is an analyst consensus of strong upside potential.
Advanced Micro Devices has a very low short interest because 1.8% of the company's shares are sold short. Institutions own 74.5% of the company's shares, and the insider ownership rate stands at 0.48%, suggesting a small amount of insider investors. The largest shareholder is Vanguard Group Inc, whose 9% stake in the company is worth $14,617,268,813.


