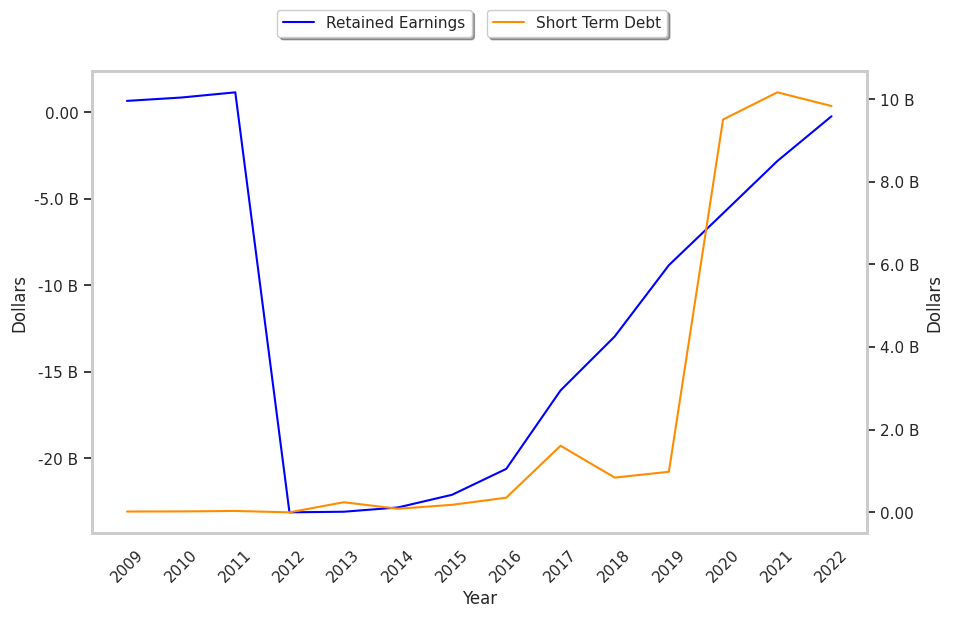
Shares of Telecommunications sector company T-Mobile US moved 0.0% today, and are now trading at a price of $147.25. The large-cap stock's daily volume was 2,413,465 compared to its average volume of 4,745,043. The S&P 500 index returned a -0.0% performance.
T-Mobile US, Inc., together with its subsidiaries, provides mobile communications services in the United States, Puerto Rico, and the United States Virgin Islands. The company is based in Bellevue and has 71,000 full time employees. Its market capitalization is $170,297,475,072. T-Mobile US currently offers its equity investors a dividend that yields 0.4% per year.
29 analysts are following T-Mobile US and have set target prices ranging from $118.49 to $235.0 per share. On average, they have given the company a rating of buy. At today's prices, TMUS is trading -17.28% away from its average analyst target price of $178.02 per share.
Over the last year, TMUS shares have gone down by -0.0%, which represents a difference of -15.0% when compared to the S&P 500. The stock's 52 week high is $153.36 per share and its 52 week low is $124.92. With average free cash flows of $854.17 Million that have been growing at an average rate of 24.0% over the last 6 years, T-Mobile US declining stock performance may not be reflective of the quality of its underlying business.
| Date Reported | Cash Flow from Operations ($ k) | Capital expenditures ($ k) | Free Cash Flow ($ k) | YoY Growth (%) |
|---|---|---|---|---|
| 2023 | 17,133,000 | 12,807,000 | 4,326,000 | 53.9 |
| 2022 | 16,781,000 | 13,970,000 | 2,811,000 | 76.68 |
| 2021 | 13,917,000 | 12,326,000 | 1,591,000 | 166.46 |
| 2020 | 8,640,000 | 11,034,000 | -2,394,000 | -652.89 |
| 2019 | 6,824,000 | 6,391,000 | 433,000 | 126.37 |
| 2018 | 3,899,000 | 5,541,000 | -1,642,000 |


