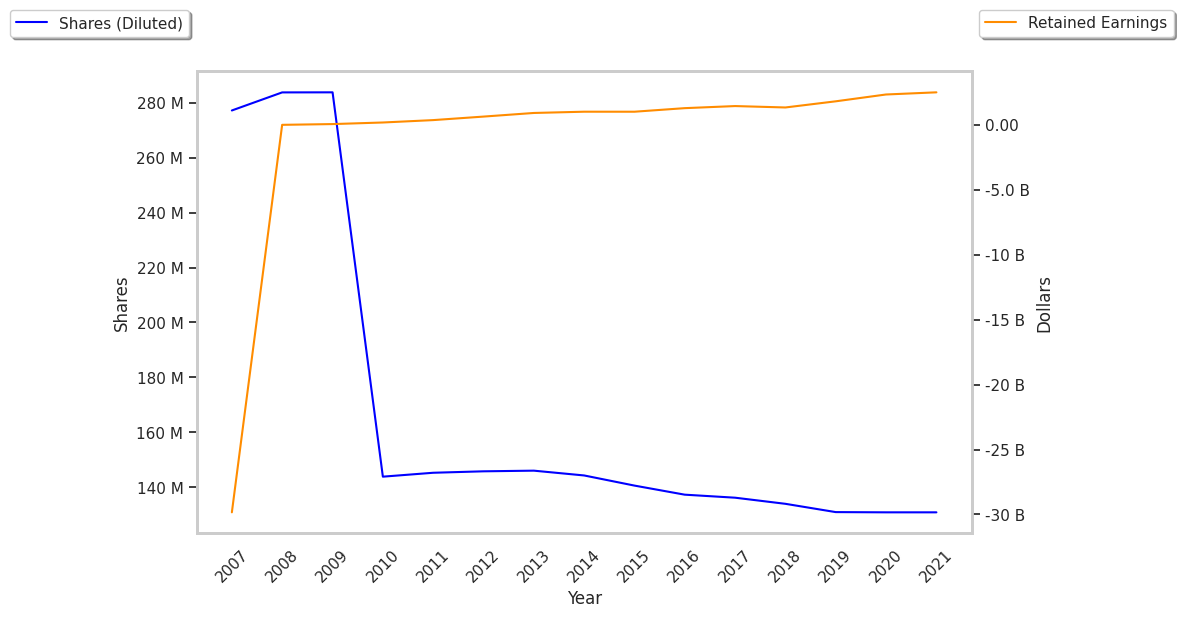
Shares of lululemon athletica inc. have moved -1.0% today, and are now trading at a price of $168.54. In contrast, the S&P 500 index saw a -0.0% change. Today's trading volume is 654,278 compared to the stock's average volume of 5,159,526.
lululemon athletica inc., together with its subsidiaries, designs, distributes, and retails technical athletic apparel, footwear, and accessories for women and men under the lululemon brand in the United States, Canada, Mexico, China Mainland, Hong Kong, Taiwan, Macau, and internationally. Based in Vancouver, Canada the company has 39,000 full time employees and a market cap of $19,987,609,600.
The company is now trading -13.28% away from its average analyst target price of $194.36 per share. The 27 analysts following the stock have set target prices ranging from $120.0 to $303.0, and on average give lululemon athletica inc. a rating of hold.
Over the last 12 months LULU shares have declined by -42.8%, which represents a difference of -63.6% when compared to the S&P 500. The stock's 52 week high is $423.32 per share and its 52 week low is $159.25. Based on lululemon athletica inc.'s average net margin growth of 1.2% over the last 6 years, its core business remains strong and the stock price may recover in the long term.
| Date Reported | Total Revenue ($ k) | Net Profit ($ k) | Net Margins (%) | YoY Growth (%) |
|---|---|---|---|---|
| 2024 | 10,588,126 | 1,814,616 | 17 | 6.25 |
| 2023 | 9,619,278 | 1,550,190 | 16 | 45.45 |
| 2022 | 8,110,518 | 854,800 | 11 | -31.25 |
| 2021 | 6,256,617 | 975,322 | 16 | 23.08 |
| 2020 | 4,401,879 | 588,913 | 13 | -18.75 |
| 2019 | 3,979,296 | 645,596 | 16 |


